
Analytics
This page describes Sourcegraph’s analytics function, our data sources, and how to use our data tools.
- Data sources
- Data tools/tech stack
- Using Looker
- Amplitude
- Analytics FAQs
- Sources of truth
- Data Analyst IC levels
Data sources
Product data
We collect two different levels of product data. The type of data we collect depends how an instance is being hosted.
- Pings we collect pings from Sourcegraph cloud, self-hosted, and managed Sourcegraph instances. These pings contain anonymous and aggregated information. There are specific guidelines that must be followed for teams to add ping data.
- User-level data: we collect anonymous, user-level, event stream data from Sourceraph cloud and Sourcegraph managed instances using our event logger. The event stream is data that is collected at the time the user does something in the product. That means, what did they do, when did they do it, what was the outcome.
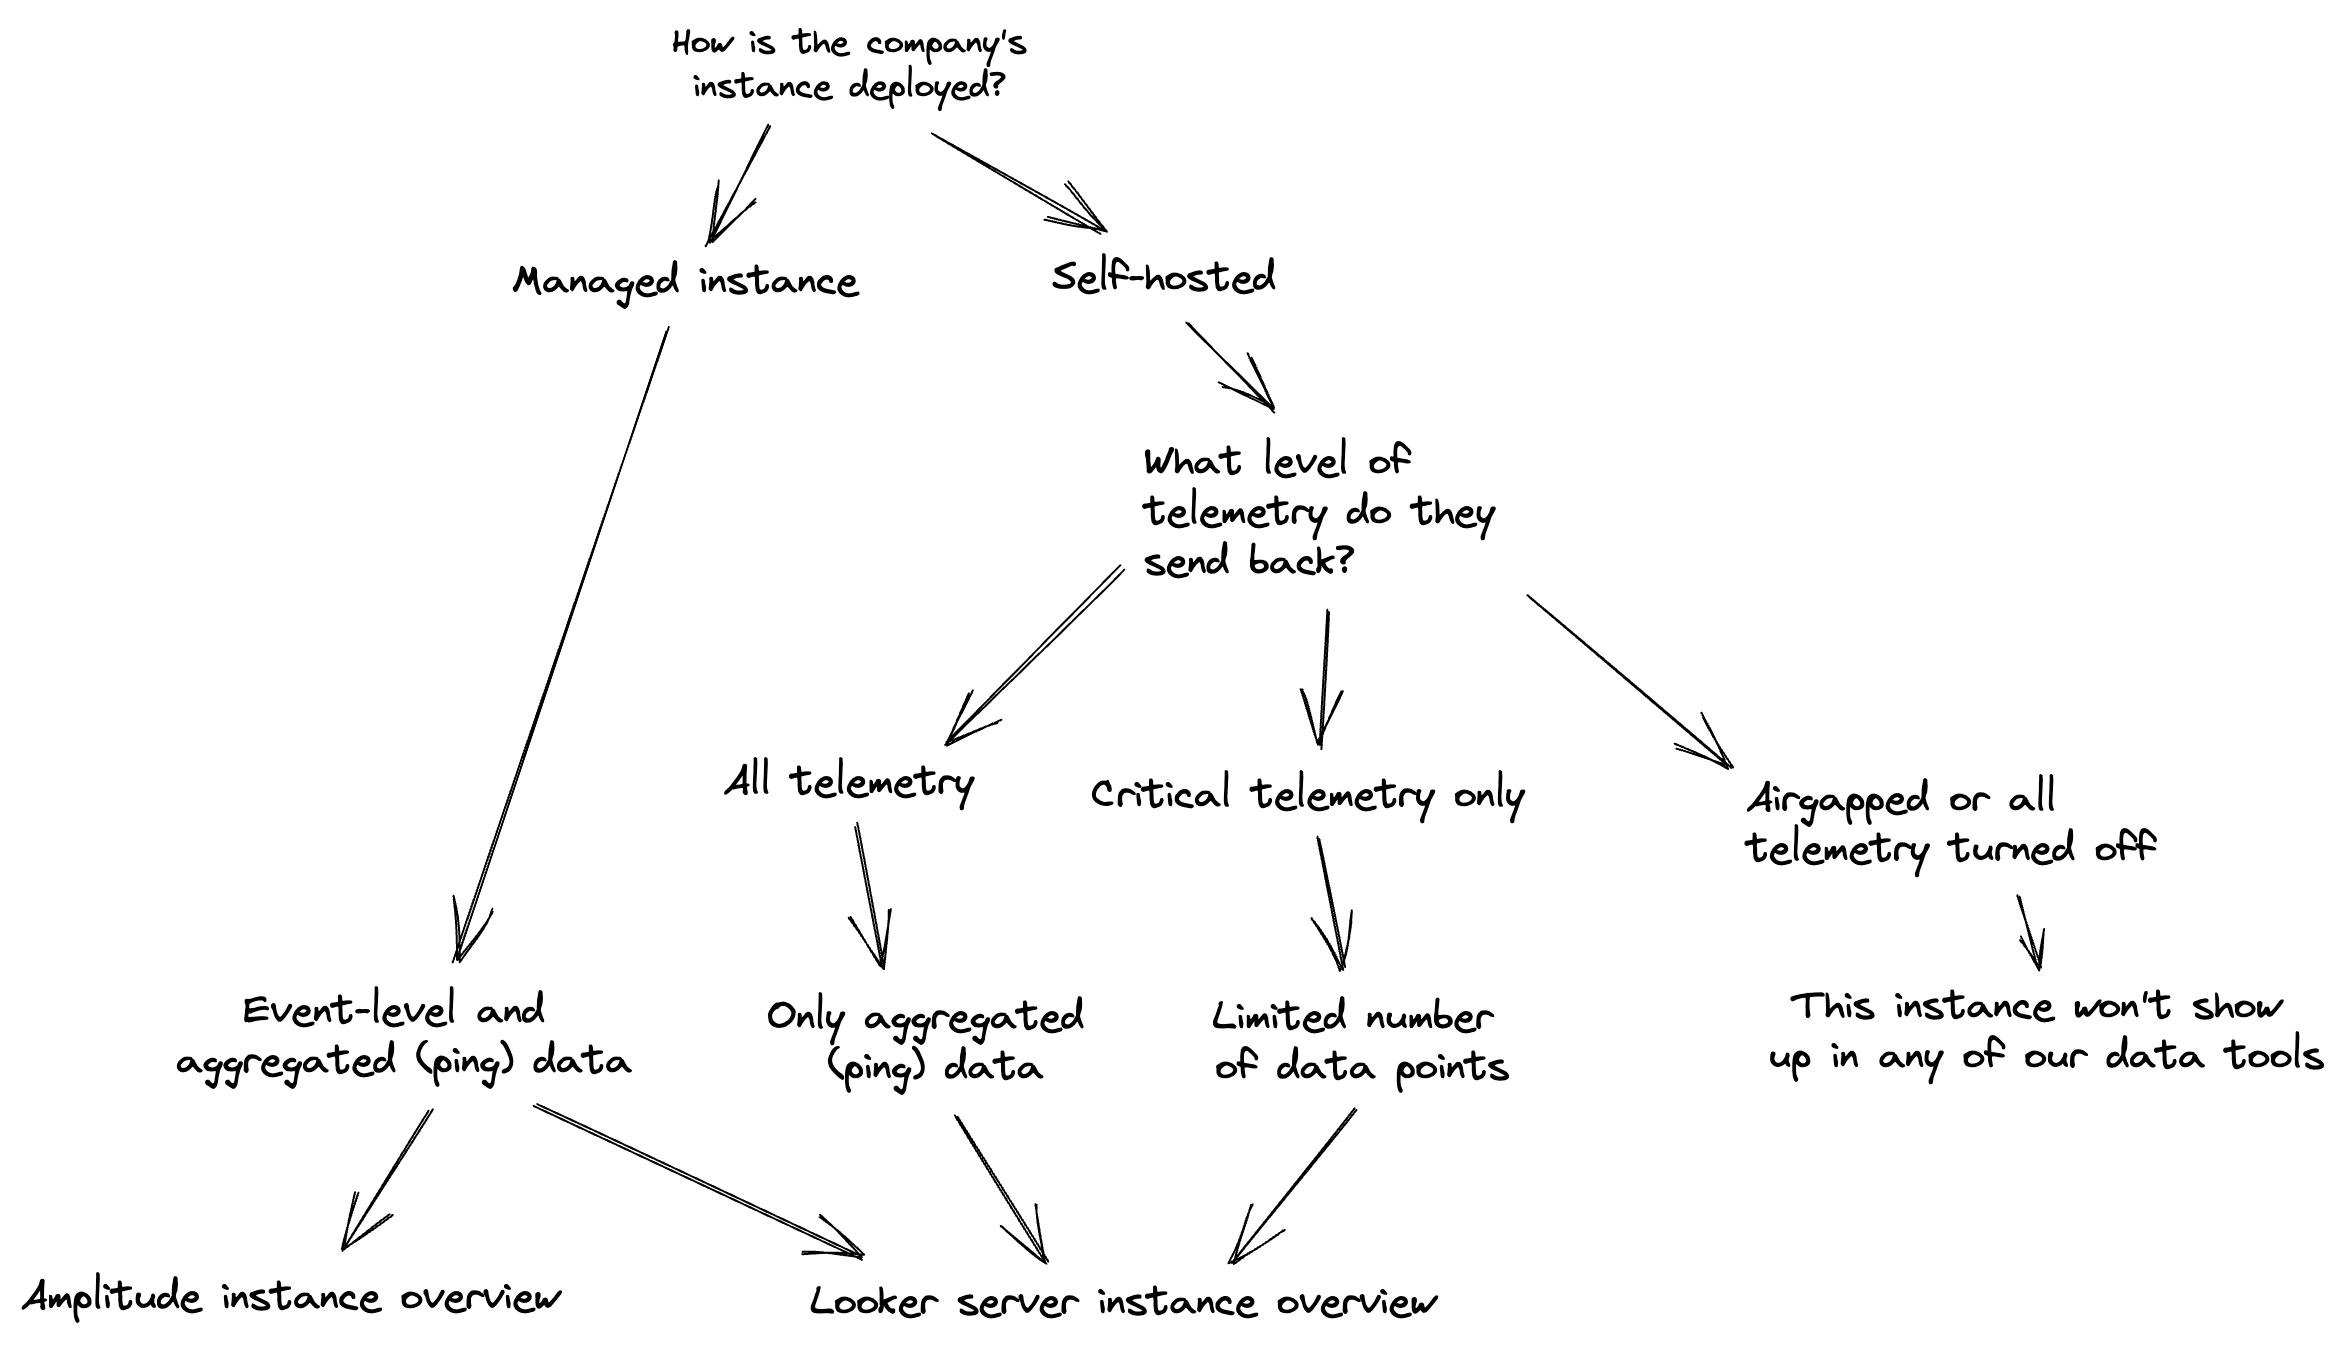
If you’re interested in which kind of data you can see for a given customer, you check their telemetry status here. The options are as follows:
- No telemetry: This self-hosted customer has an airgapped instance, or has turned pings off. We don’t have any data about this customer’s product usage
- Critical pings: This self-hosted customer has elected to send us only the pings that are required for billing, support, updates, and security notices
- Full pings: This self-hosted customer sends us all the aggregated, anonymoous data we outline here
- Full pings + user-level data: This managed instance customer sends us all the aggregated, anonymous data outlined in our documentation, in addition to anonymous, user-level, event stream data from our event logger
Which data tool should I use for instance data?
Other data sources
We also collect data from the following:
- Google Analytics: Website analytics for Sourcegraph marketing and docs pages (not Sourcegraph.com)
- Google Tag Manager: Tag management system to collect event data and execute custom scripts across marketing our sites (i.e. (about|info|docs).sourcegraph.com)
- HubSpot: Marketing automation
- Salesforce: Customer Relationship Management system (CRM)
- MixMax: Email marketing automation (Apollo is not used in production, but still retains data)
- ZoomInfo: Data enrichment of account and contact information
- Sourcegraph.com Site-admin pages: customer subscriptions and license keys
- Sourcegraph production database: we query a few particular tables from the production database via terraform to access data for Sourcegraph cloud.
- Prometheus dashboards show high-level insight into the health of a Sourcegraph instance to admins. Sourcegraph teammates can see the health of Sourcegraph.com.
- Customer Environment Questions
We have written policies about how we handle customer information.
Data tools
- Looker: Business intelligence/data visualization tool
- Google Cloud Platform: BigQuery is our data warehouse and the database Looker runs on top of
- Fivetran: Fivetran is a no code data integrator that can facilitate syncing data from internal business applications to BigQuery. Current pipelines running with Fivetran: Salesforce, Hubspot, GitHub (coming soon). All Data and Analytics team members have access to create pipelines, please reach out to #analytics to request a new pipeline.
- Google Sheets: There are a number of spreadsheets that Looker queries (by way of BigQuery).
- BizOps builds ad-hoc tools to analyze data for various reasons. The projects are in the Google Drive Analytics folder and the source code is available in the analytics repo.
- For further explanation on how we use these tools, see the data workflows page
Data pipelines
Every underlying data source (not chart!) is assumed to always be up-to-date unless noted otherwise.
Google BigQuery
- Most “data pipelines” are SQL queries that turn raw ping data into clean datasets for analysis.
- Data pipeline from Sourcegraph’s postgres database to BigQuery runs via Terraform. To schedule/update these queries:
- Create a pull request with the necessary update here and a member of the cloud-devops team will review and deploy the changes
- Update the scheduled query in BigQuery. Note that that the query needs to be run by the service account, otherwise it will encounter permissions errors. To do so, use the following command in the BigQuery CLI:
gcloud config set project <analytics-proj> && bq update --transfer_config --update_credentials --service_account_name=<desired_sa> projects/xxxxxxxx/locations/us/transferConfigs/xxxxxx
HubSpot
The HubSpot data pipeline is updated once per day (in the afternoon PST). If you need the latest data at any time, post in the #analytics channel in Slack and the BizOps team can run the pipeline manually.
Using Looker
Looker is a self-service tool with many pre-built reports and visualizations. The onboarding doc is located in Looker. Reach out in the #analytics Slack channel if you have any questions, we’re happy to help!
How to
- Add metrics on Sourcegraph Cloud?
- Add metrics on Sourcegraph on-prem?
Quick links
Things to know about using Looker
- By clicking
Explore from hereor changing a filter on a dashboard, you will not change the underlying dashboard. Unless you explicitly clickEdit, you are considered to be on your own temporary branch and will not change anything (even for yourself the next time you open the dashboard). - When creating and editing dashboards, save individual tables and charts as looks instead of tiles directly to the dashboard. Looks can be added to multiple dashboards while tiles cannot be, and when look is edited, the changes will apply to dashboards where that look exists.
Downsides of Looker (and our plans to address them)
- Discoverability of data: Bookmarking, favoriting or adding the sales/customer engineering board, product/engineering board and server instances overview look (or some combination of them) to your Looker instance is the best solution right now. These are all kept up-to-date with the most relevant data for all teams.
- Speed: Looker’s UI makes it easy to analyze data, but the result is a really complex SQL query that take awhile to run (especially on dashboards that are compiled of many separate queries). Fixing the performance issues is not currently a priority, but is something that we’ll get to when we grow the team out.
- Naming conventions: We’re slowly working on making naming conventions of dashboards, graphs, data points, etc… more obvious. If you come across anything that isn’t clear, let us know!
Looker administration
When adding a user to Looker, they need to be in both the group and role:
- Engineering, marketing, customer support, people ops, talent, CTO users = View
- CE, sales, product users = View
- Any other teams not listed should default to ‘View’
- Generally, CE, sales, product, customer support, engineering, CTO, and marketing receive accounts when joining the company
- Reach out to #analytics channel if you need elevated permissions - to create content, for example.